Forecasting the death of StackOverflow
You've probably seen the news: StackOverflow is almost dead
 If nothing extraordinary happens, the site's run is basically over and it may end up as one of the first high-profile casualties of the LLM era.
The only real question is when.
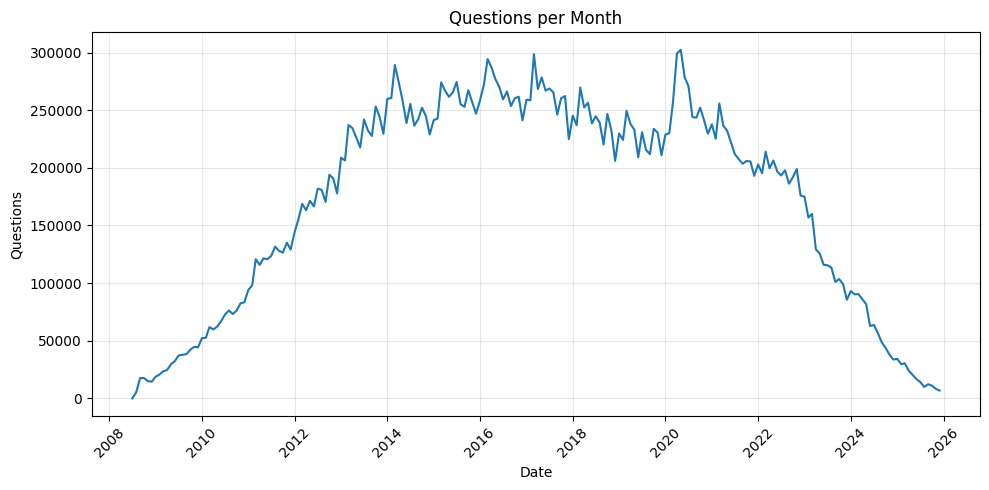
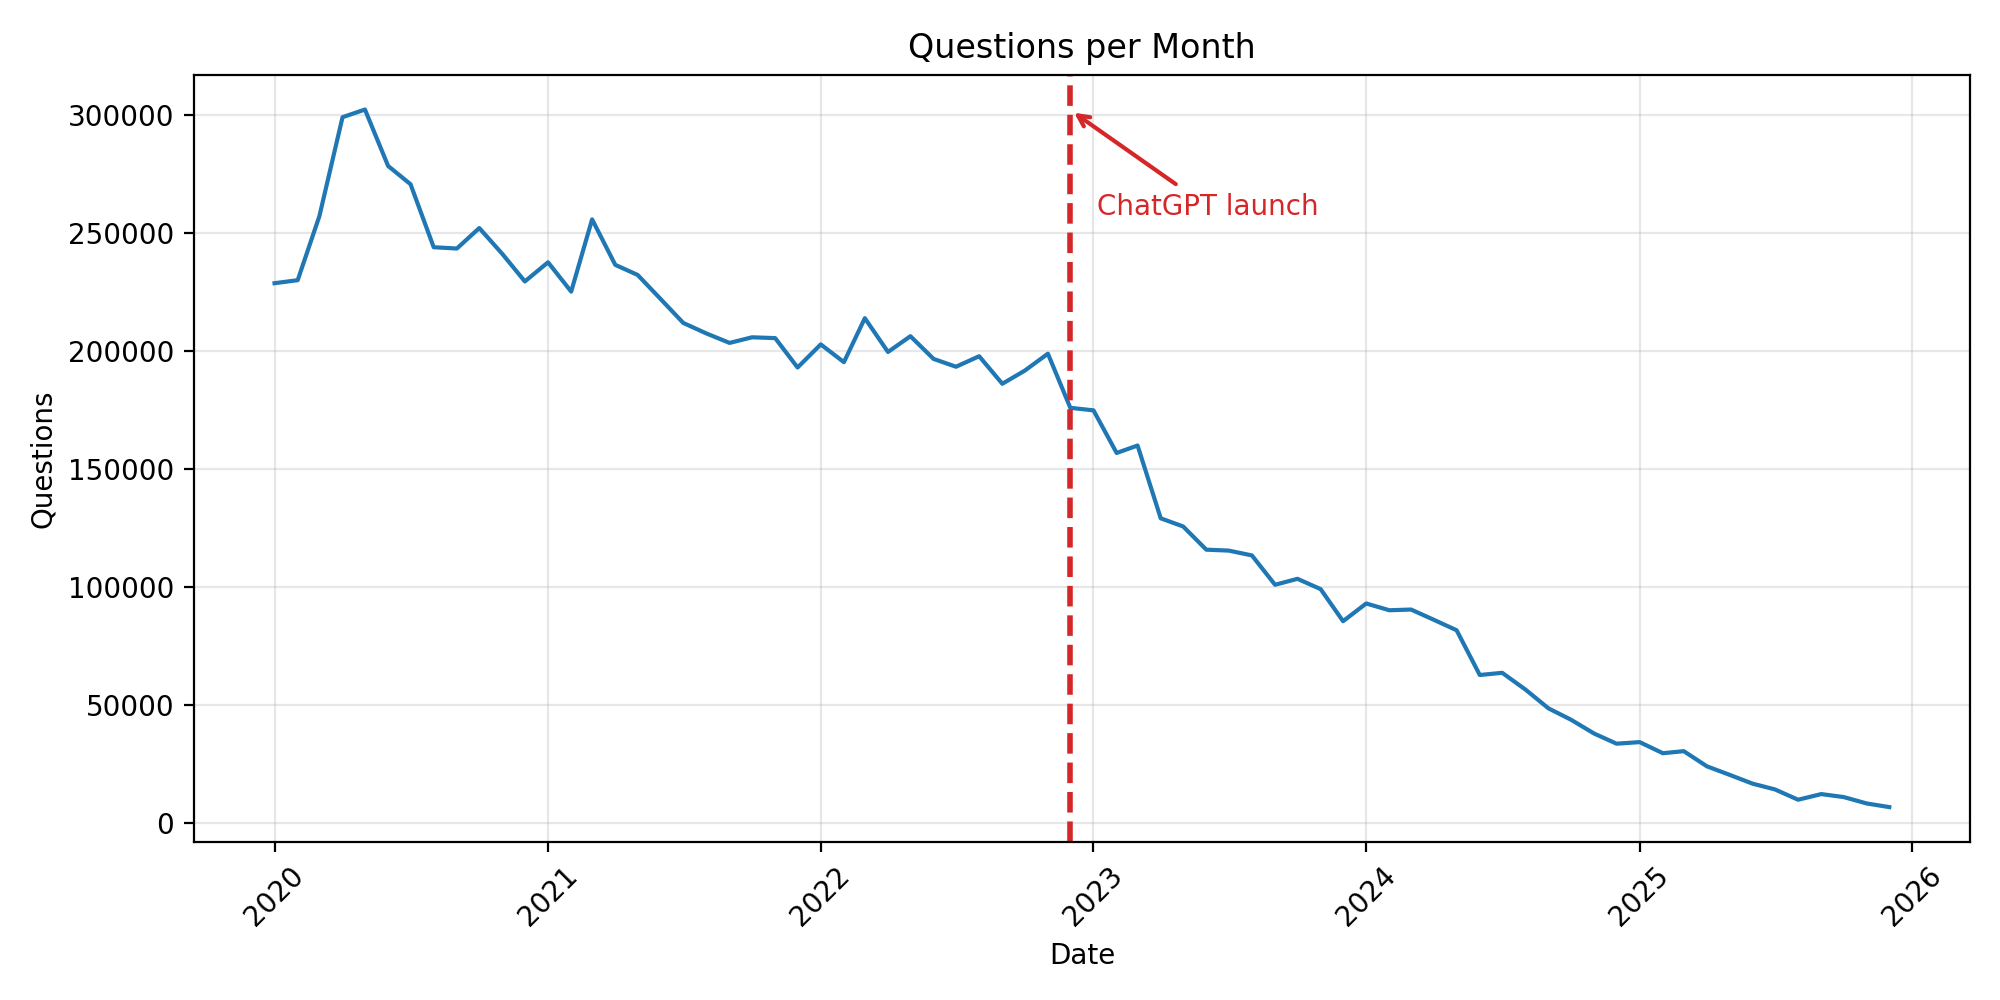
It looks like the all-time high was reached during the COVID lockdowns. Then, after the release of ChatGPT (November 30, 2022), the decline accelerated sharply.
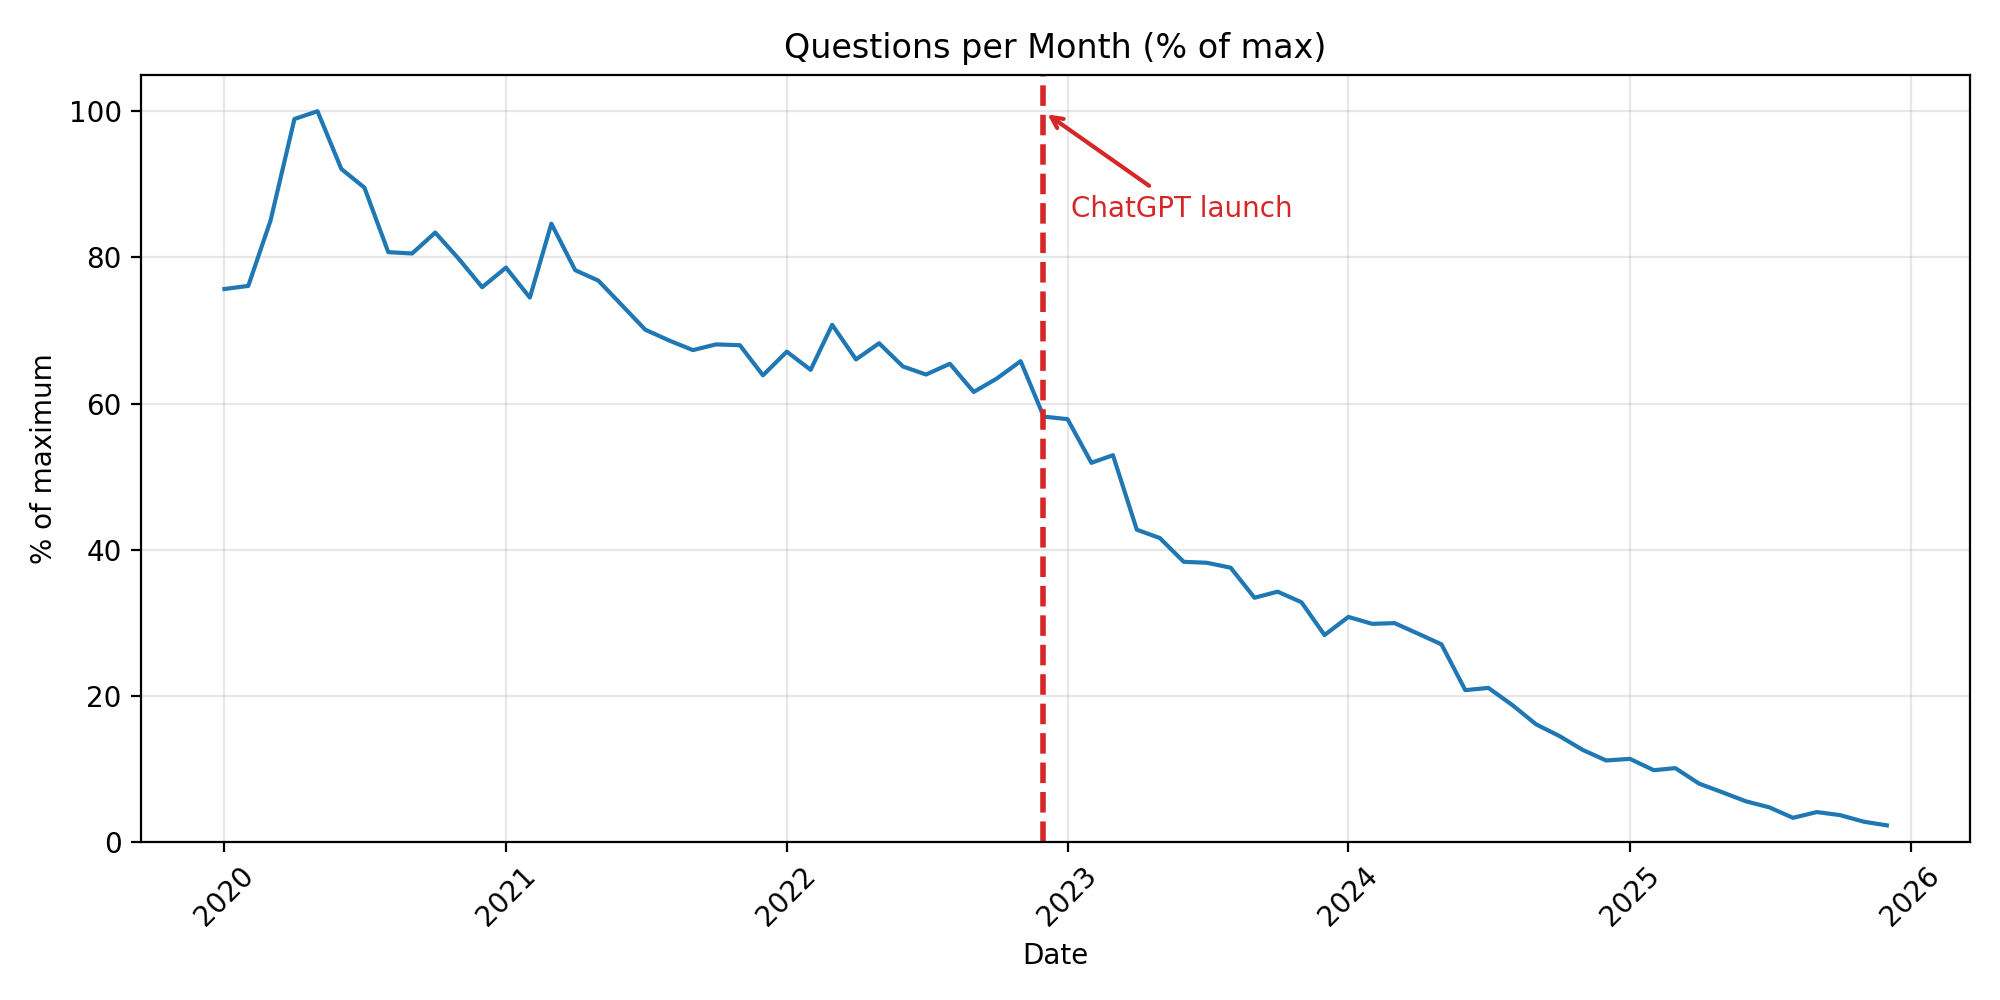
Here is the same graph, but relative to the all-time high.
The statistics are grim. The last positive YoY change came during the COVID lockdown spike. By 2023, the drop stops looking like a slow decline and starts looking like a collapse.
| Year | Avg questions per month | YoY % change |
|---|---|---|
| 2015 | 258,810 | +2.1% |
| 2016 | 266,787 | +3.1% |
| 2017 | 263,134 | -1.4% |
| 2018 | 240,740 | -8.5% |
| 2019 | 226,444 | -5.9% |
| 2020 | 256,441 | +13.2% |
| 2021 | 219,768 | -14.3% |
| 2022 | 196,603 | -10.5% |
| 2023 | 123,436 | -37.2% |
| 2024 | 65,788 | -46.7% |
| 2025 | 18,269 | -72.2% |
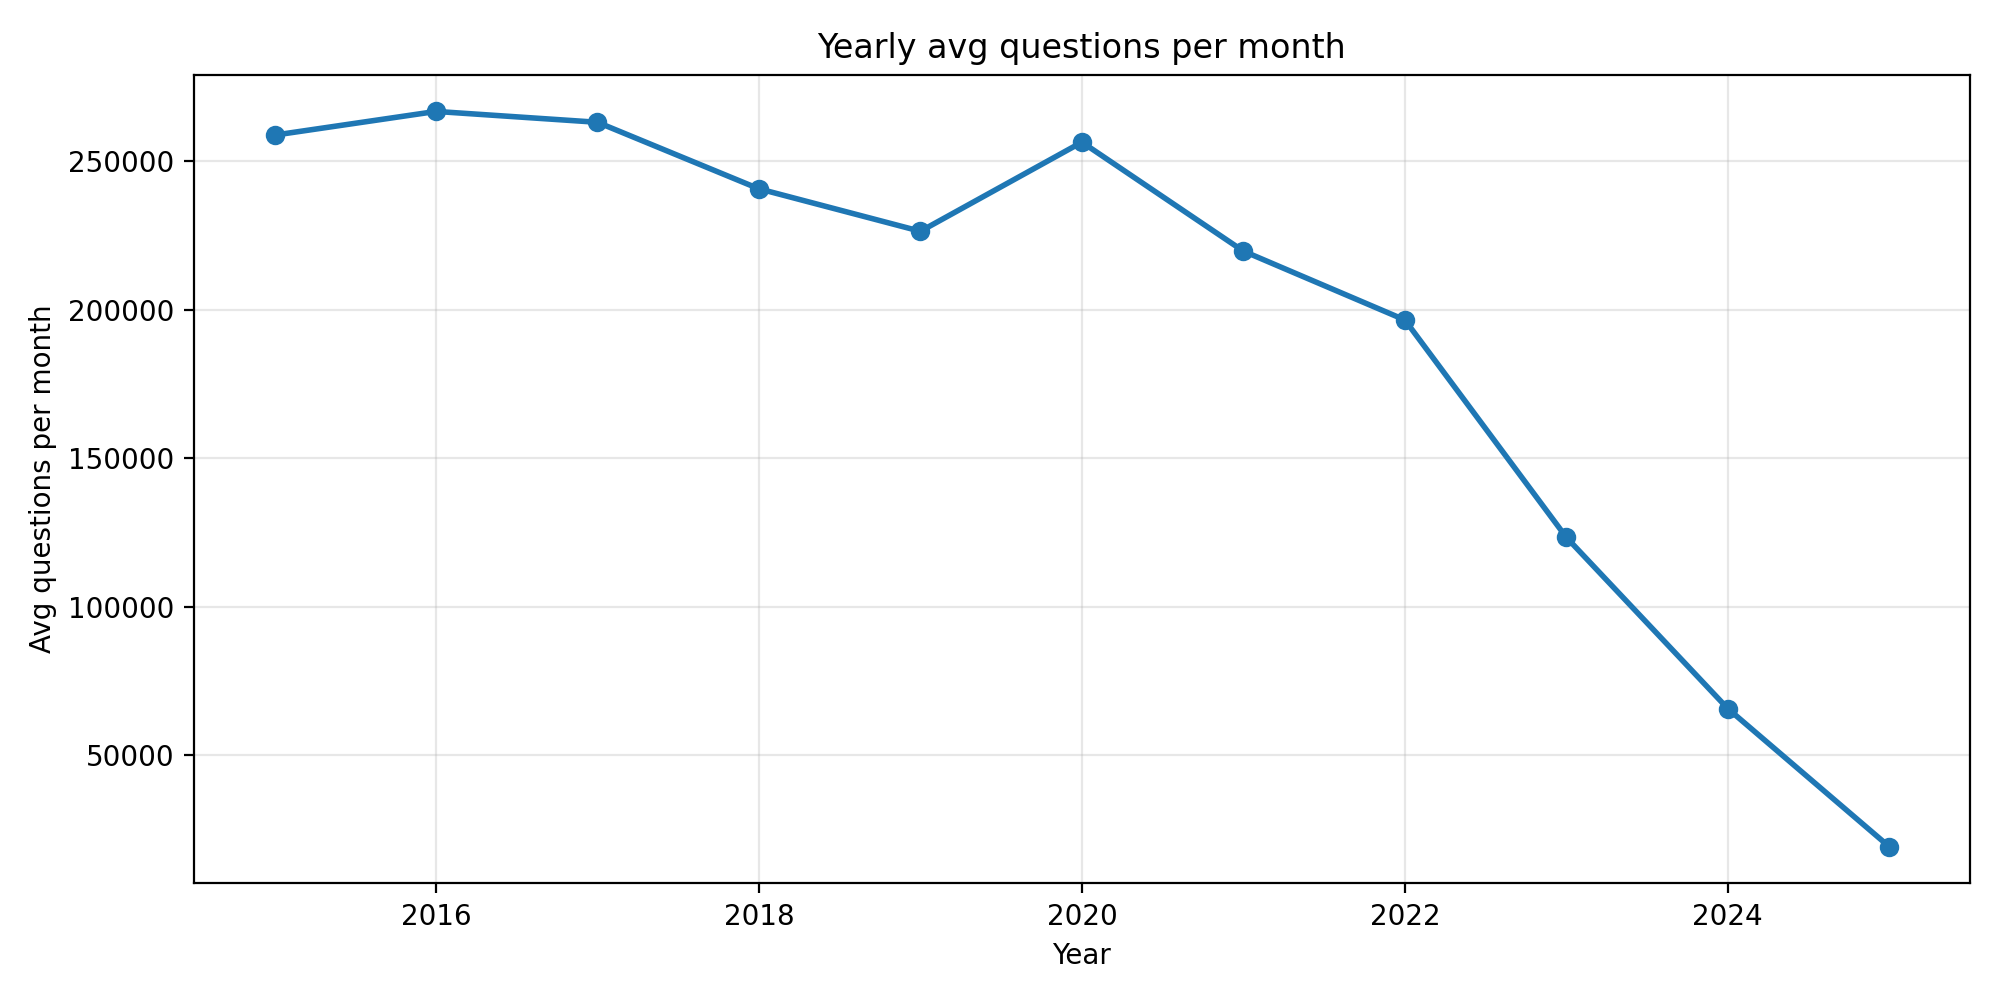
The chart speaks for itself. Let's try our first model: linear regression on yearly average questions per month.
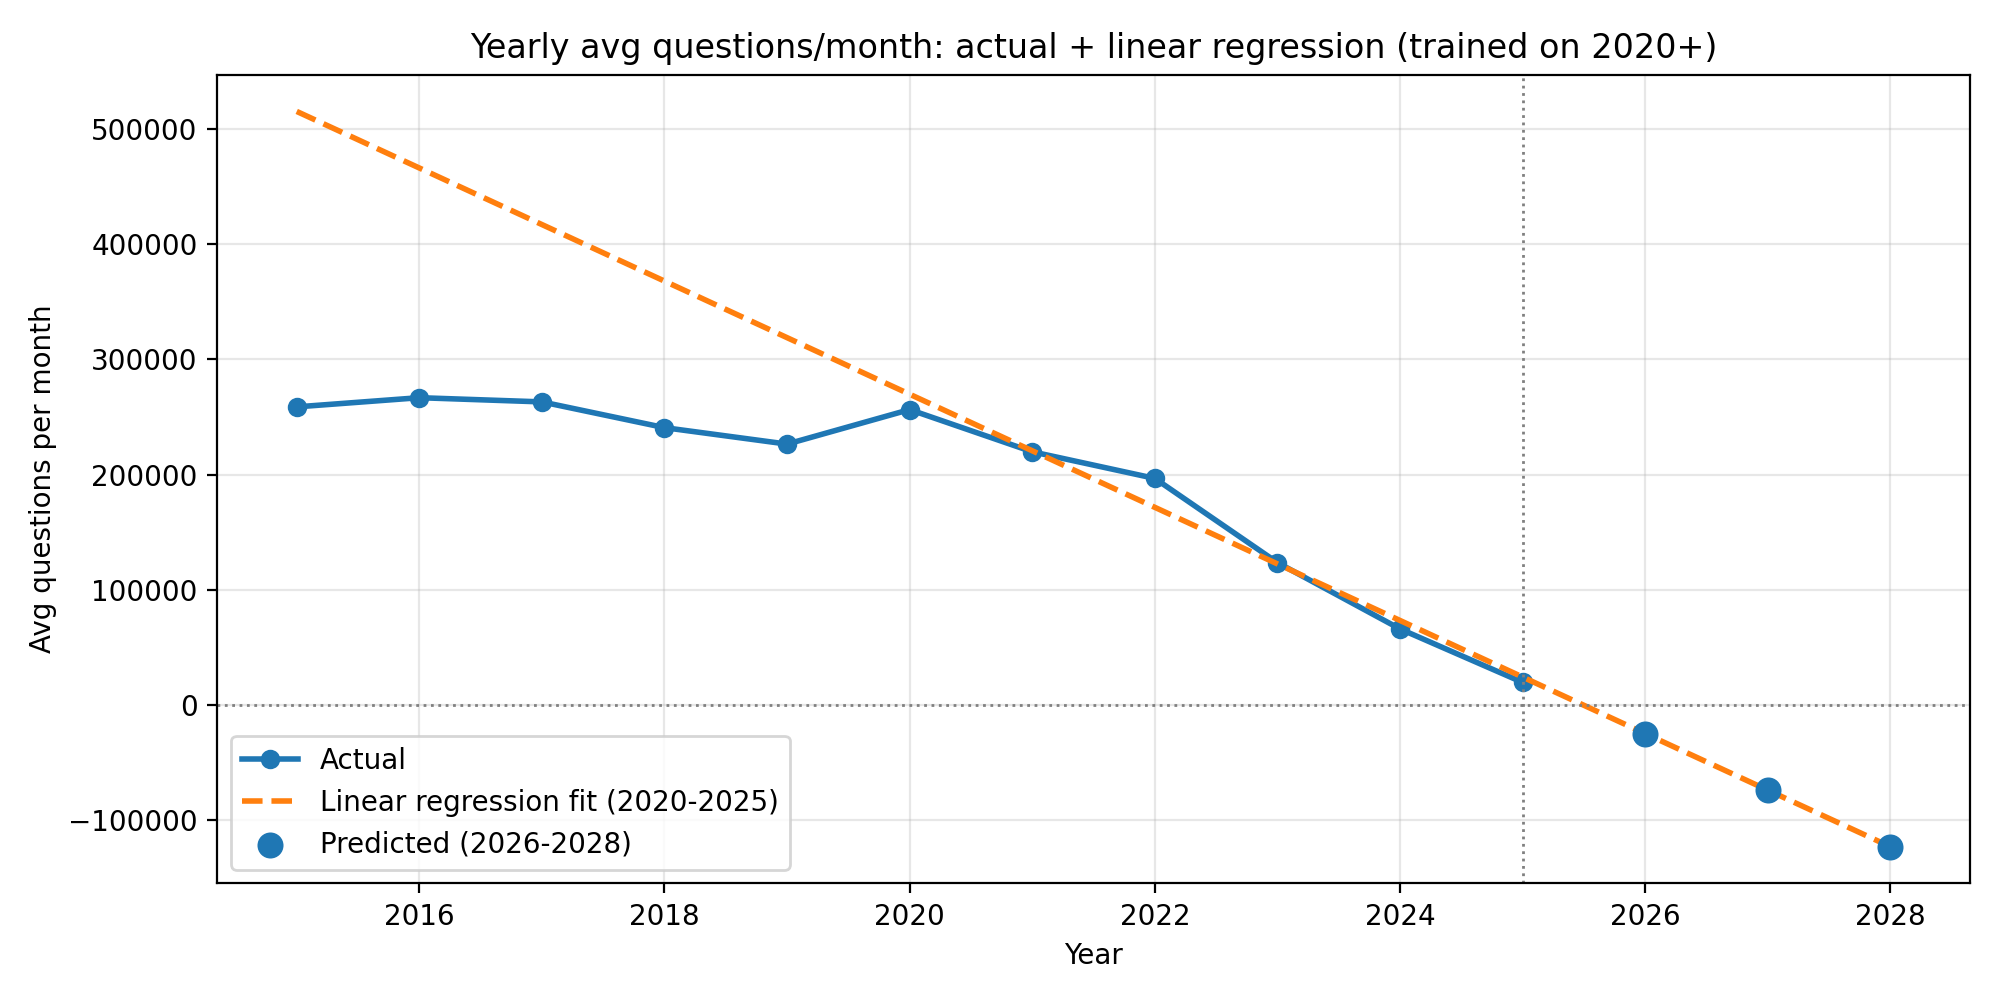
Well, it's not very plausible, the model suggests that StackOverflow won't even survive 2026.
The problem is that linear regression assumes constant absolute change, e.g., you lose the same number of questions each year.
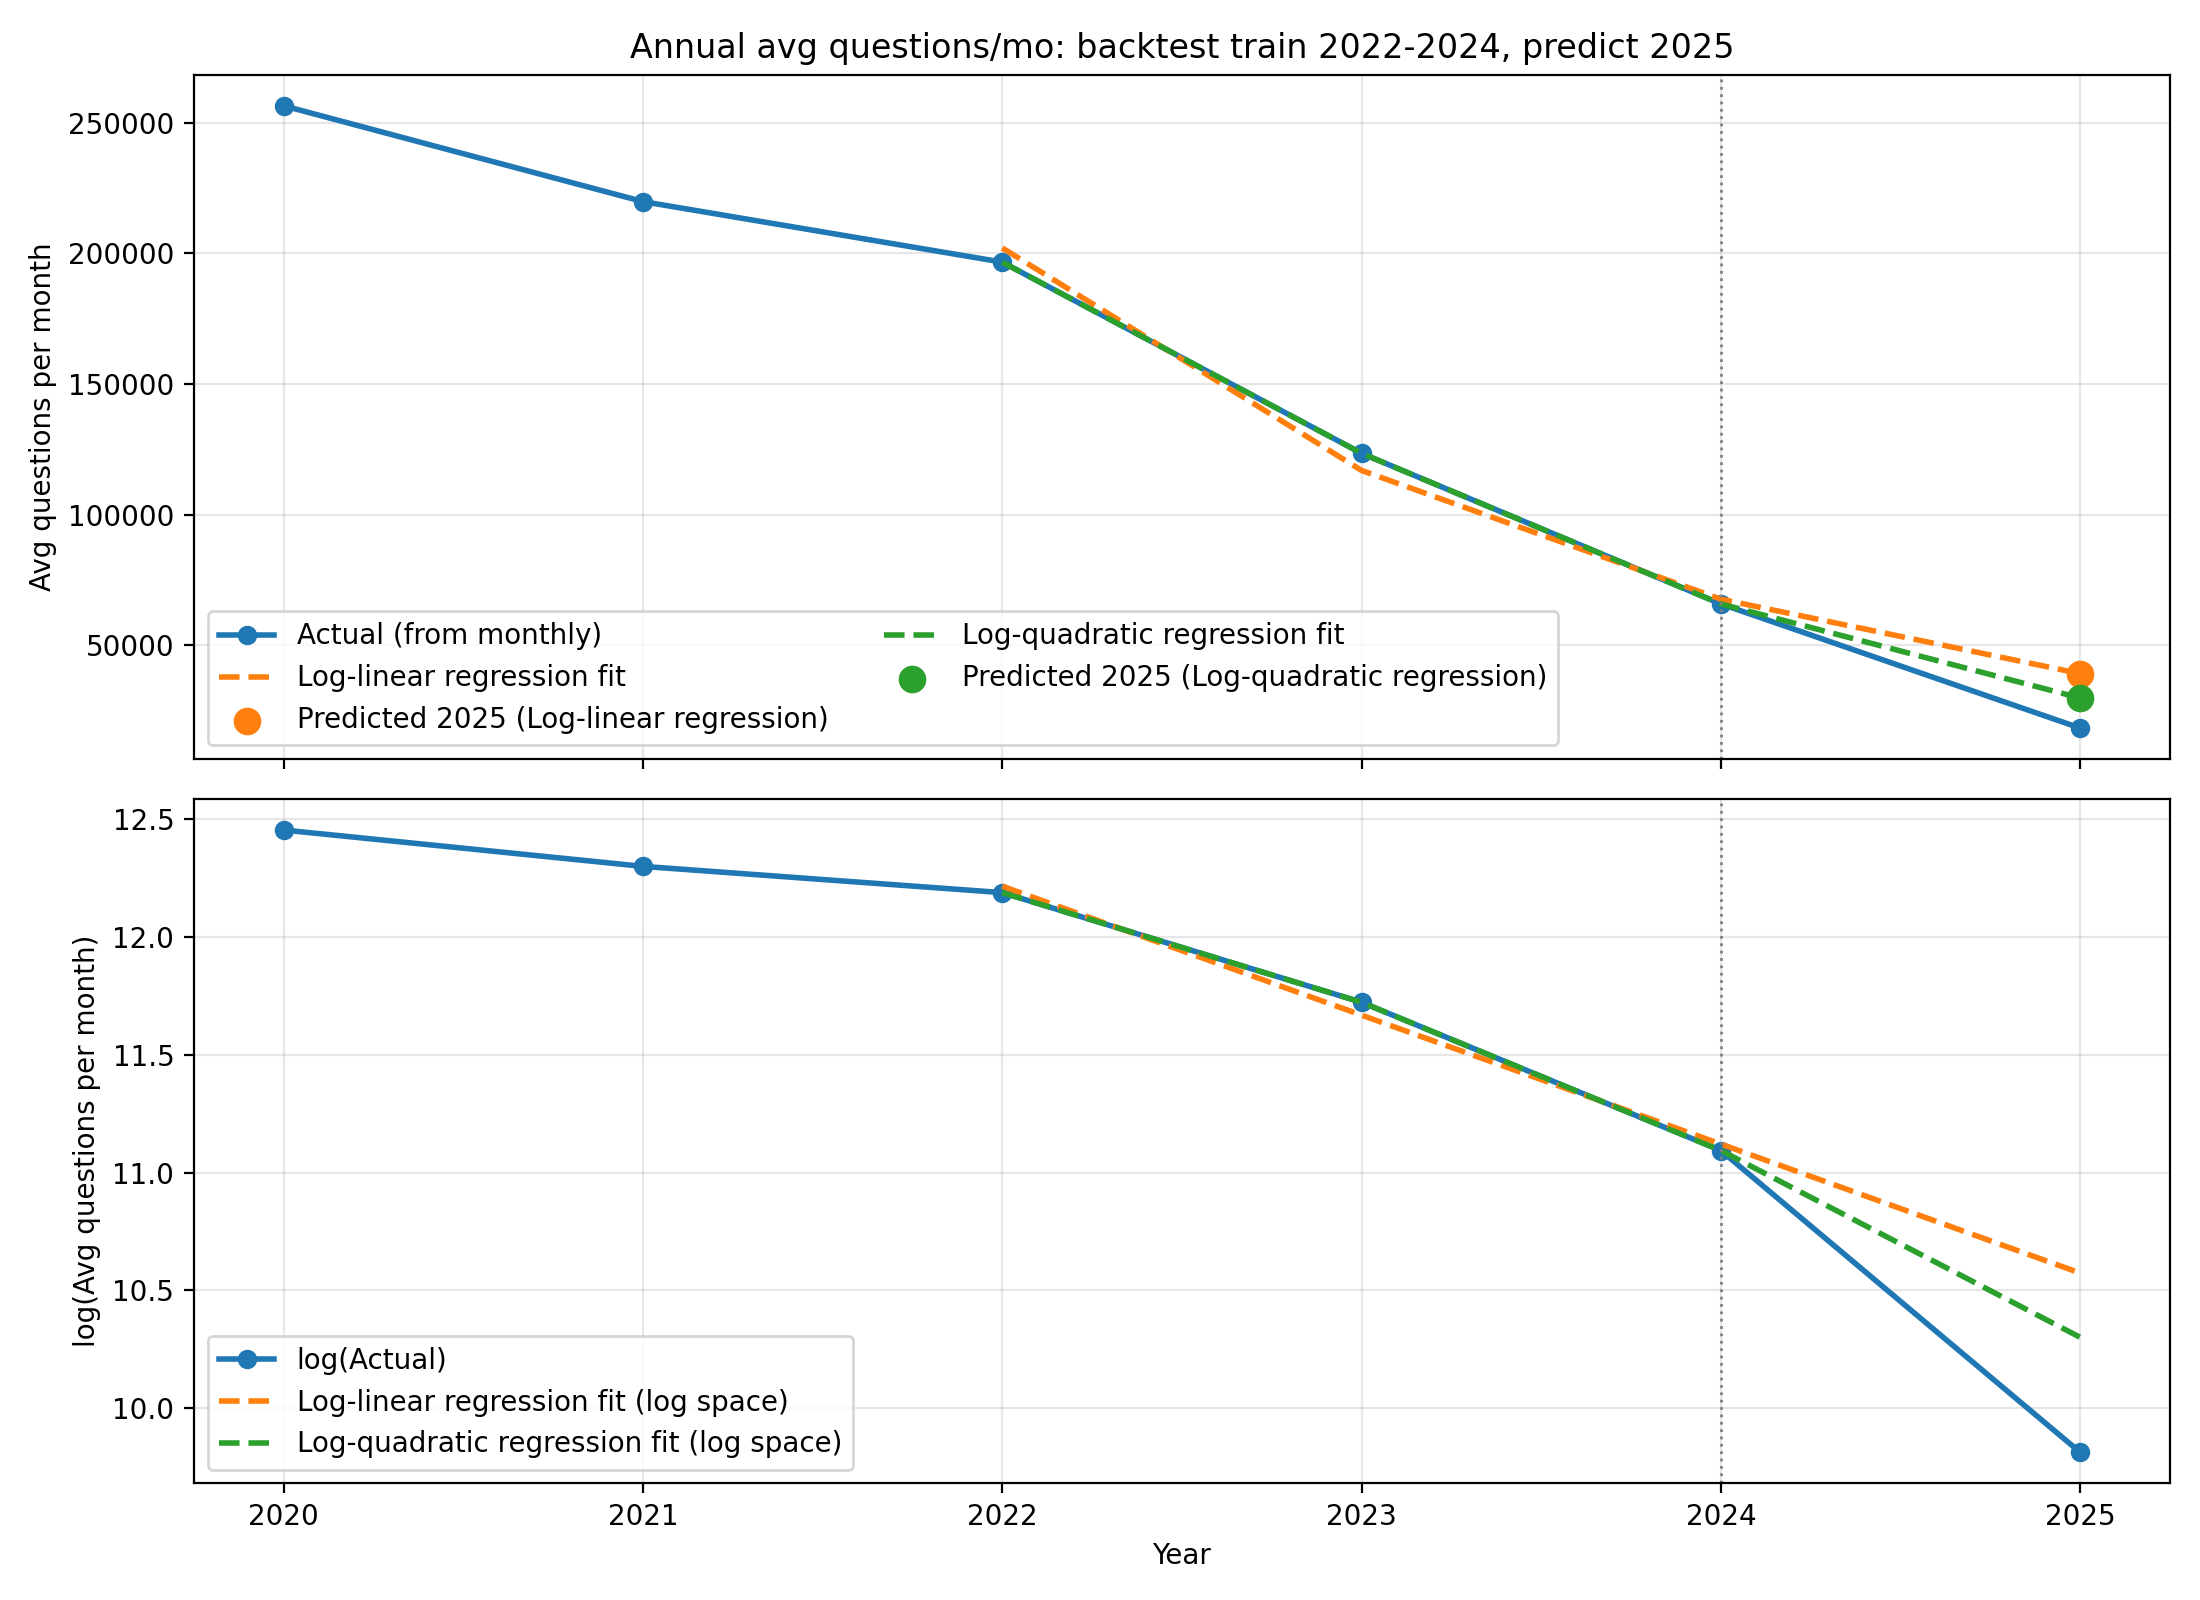
A more natural assumption is multiplicative decline: the site shrinks by a percentage, not by a fixed amount. So let's take the logarithm of the question counts and run the same linear regression in log-space.
From now on we will train on 2022-2024 data and test on 2025. At the end, we will try to predict beyond 2025.
Annual avg questions/month
The log-linear model implies a constant relative rate of change (exponential decay). The log-quadratic model allows the relative rate to drift over time - i.e., accelerating or slowing decline.
| Model | Train window | Predicted 2025 (avg/mo) | Actual 2025 (avg/mo) | Error | Error % |
|---|---|---|---|---|---|
| Log-linear regression | 2022-2024 | 39,109 | 18,269 | 20,840 | +114.1% |
| Log-quadratic regression | 2022-2024 | 29,764 | 18,269 | 11,495 | +62.9% |
We can also look at the year-over-year (YoY) percentage change.
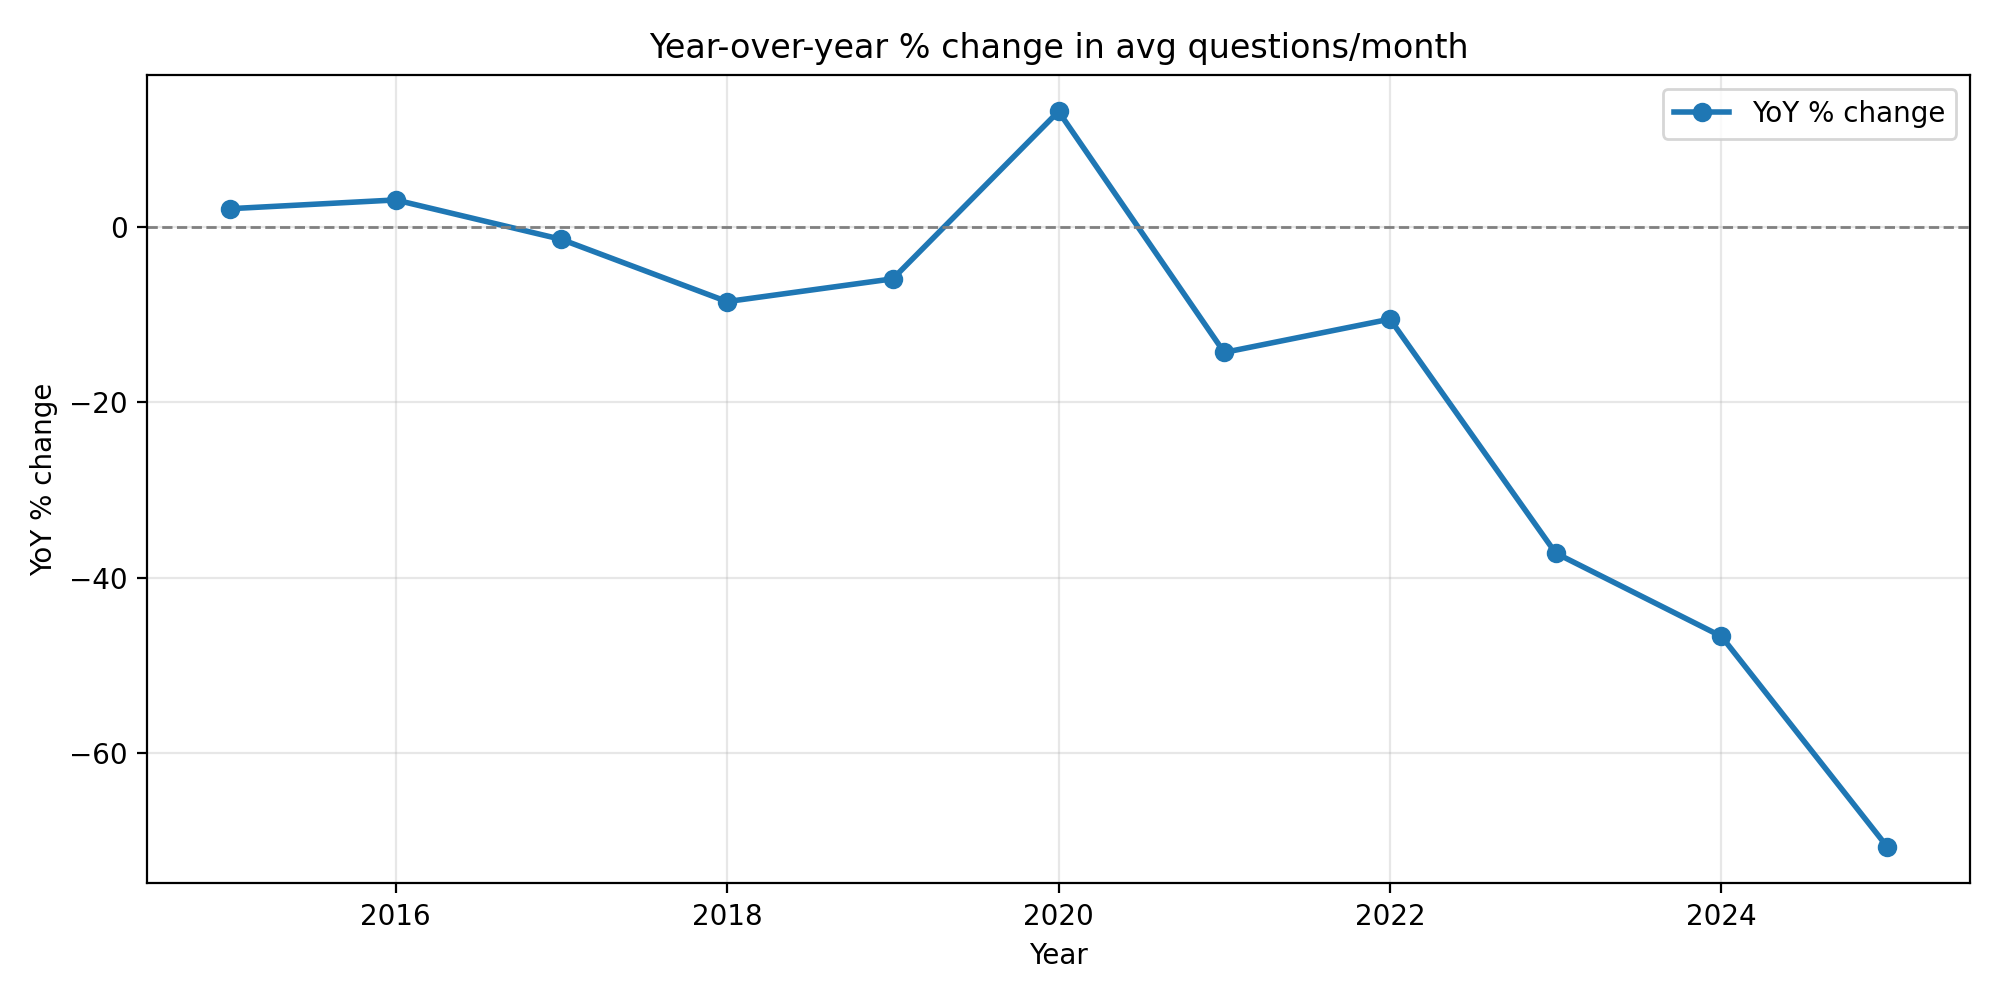
There's a clear trend here too. Instead of modeling the absolute volume, we can try modeling the rate of decline itself and see what happens.
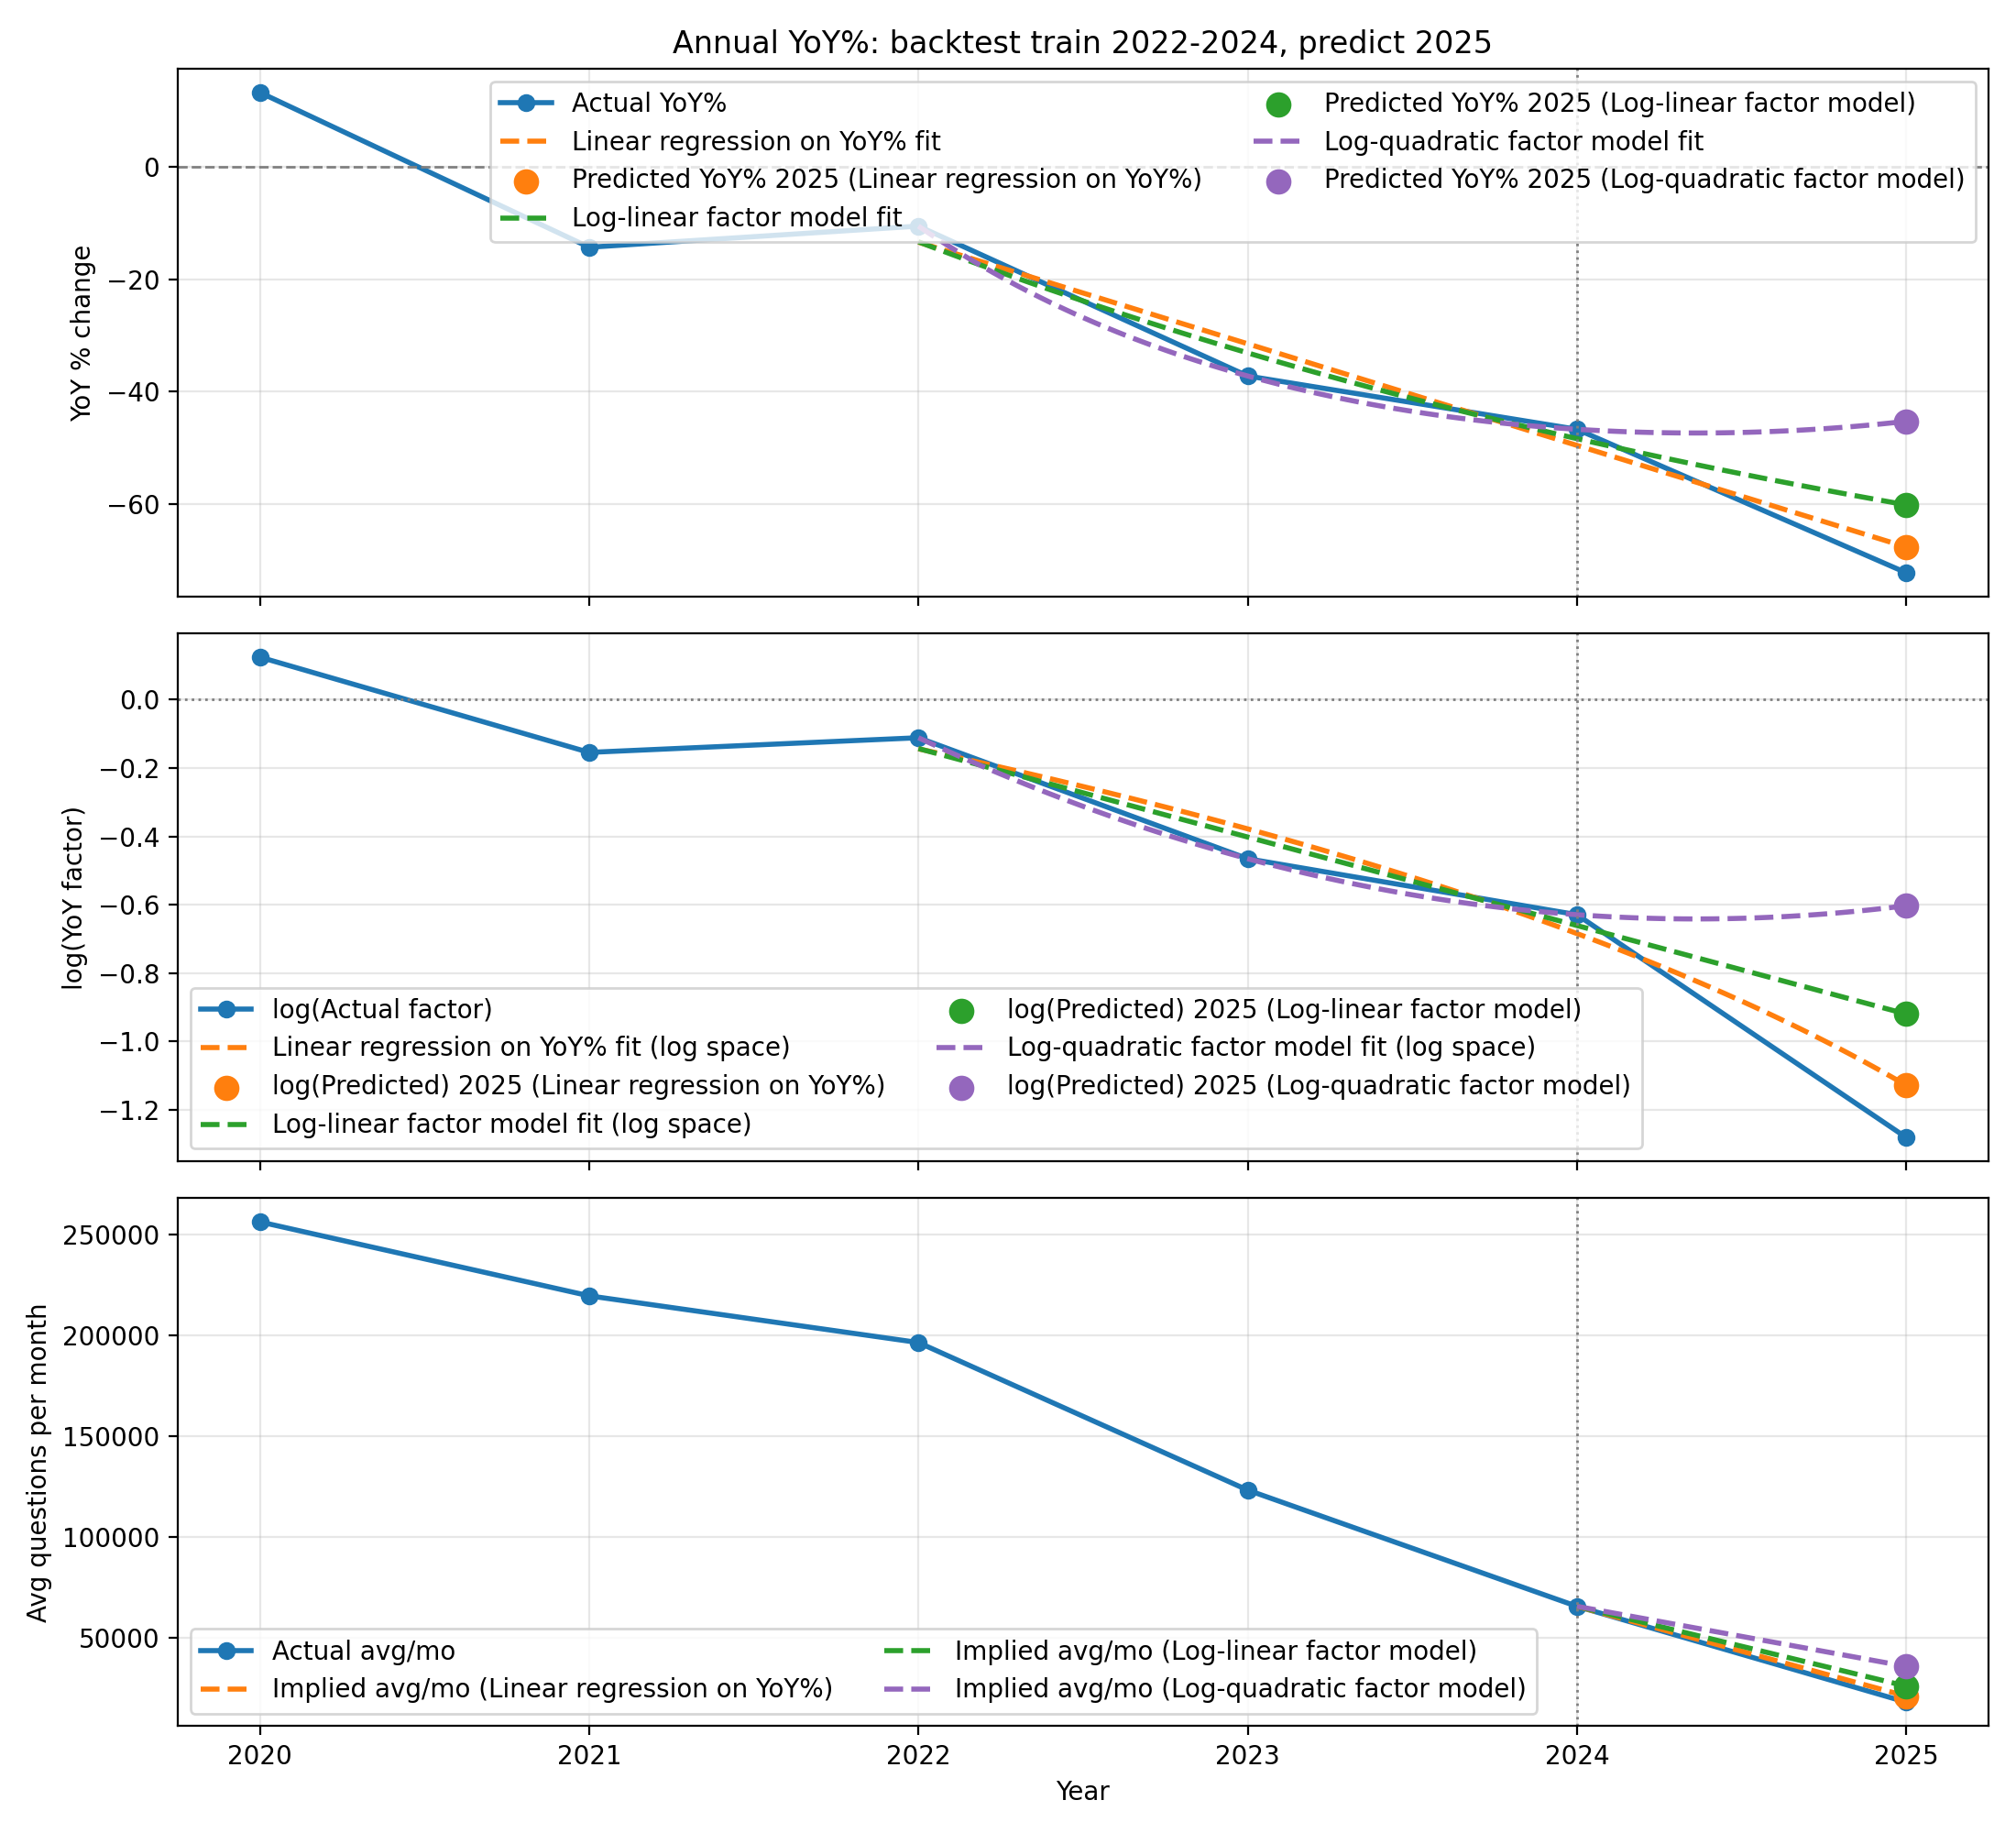
Annual YoY% (and implied avg)
| Model | Train window | Pred YoY% 2025 | Actual YoY% 2025 | Pred 2025 (avg/mo) | Actual 2025 (avg/mo) | Error | Error % |
|---|---|---|---|---|---|---|---|
| Linear regression on YoY% | 2022-2024 | -67.6% | -72.2% | 21,283 | 18,269 | 3,014 | +16.5% |
| Log-linear factor model | 2022-2024 | -60.1% | -72.2% | 26,219 | 18,269 | 7,950 | +43.5% |
| Log-quadratic factor model | 2022-2024 | -45.3% | -72.2% | 36,001 | 18,269 | 17,732 | +97.1% |
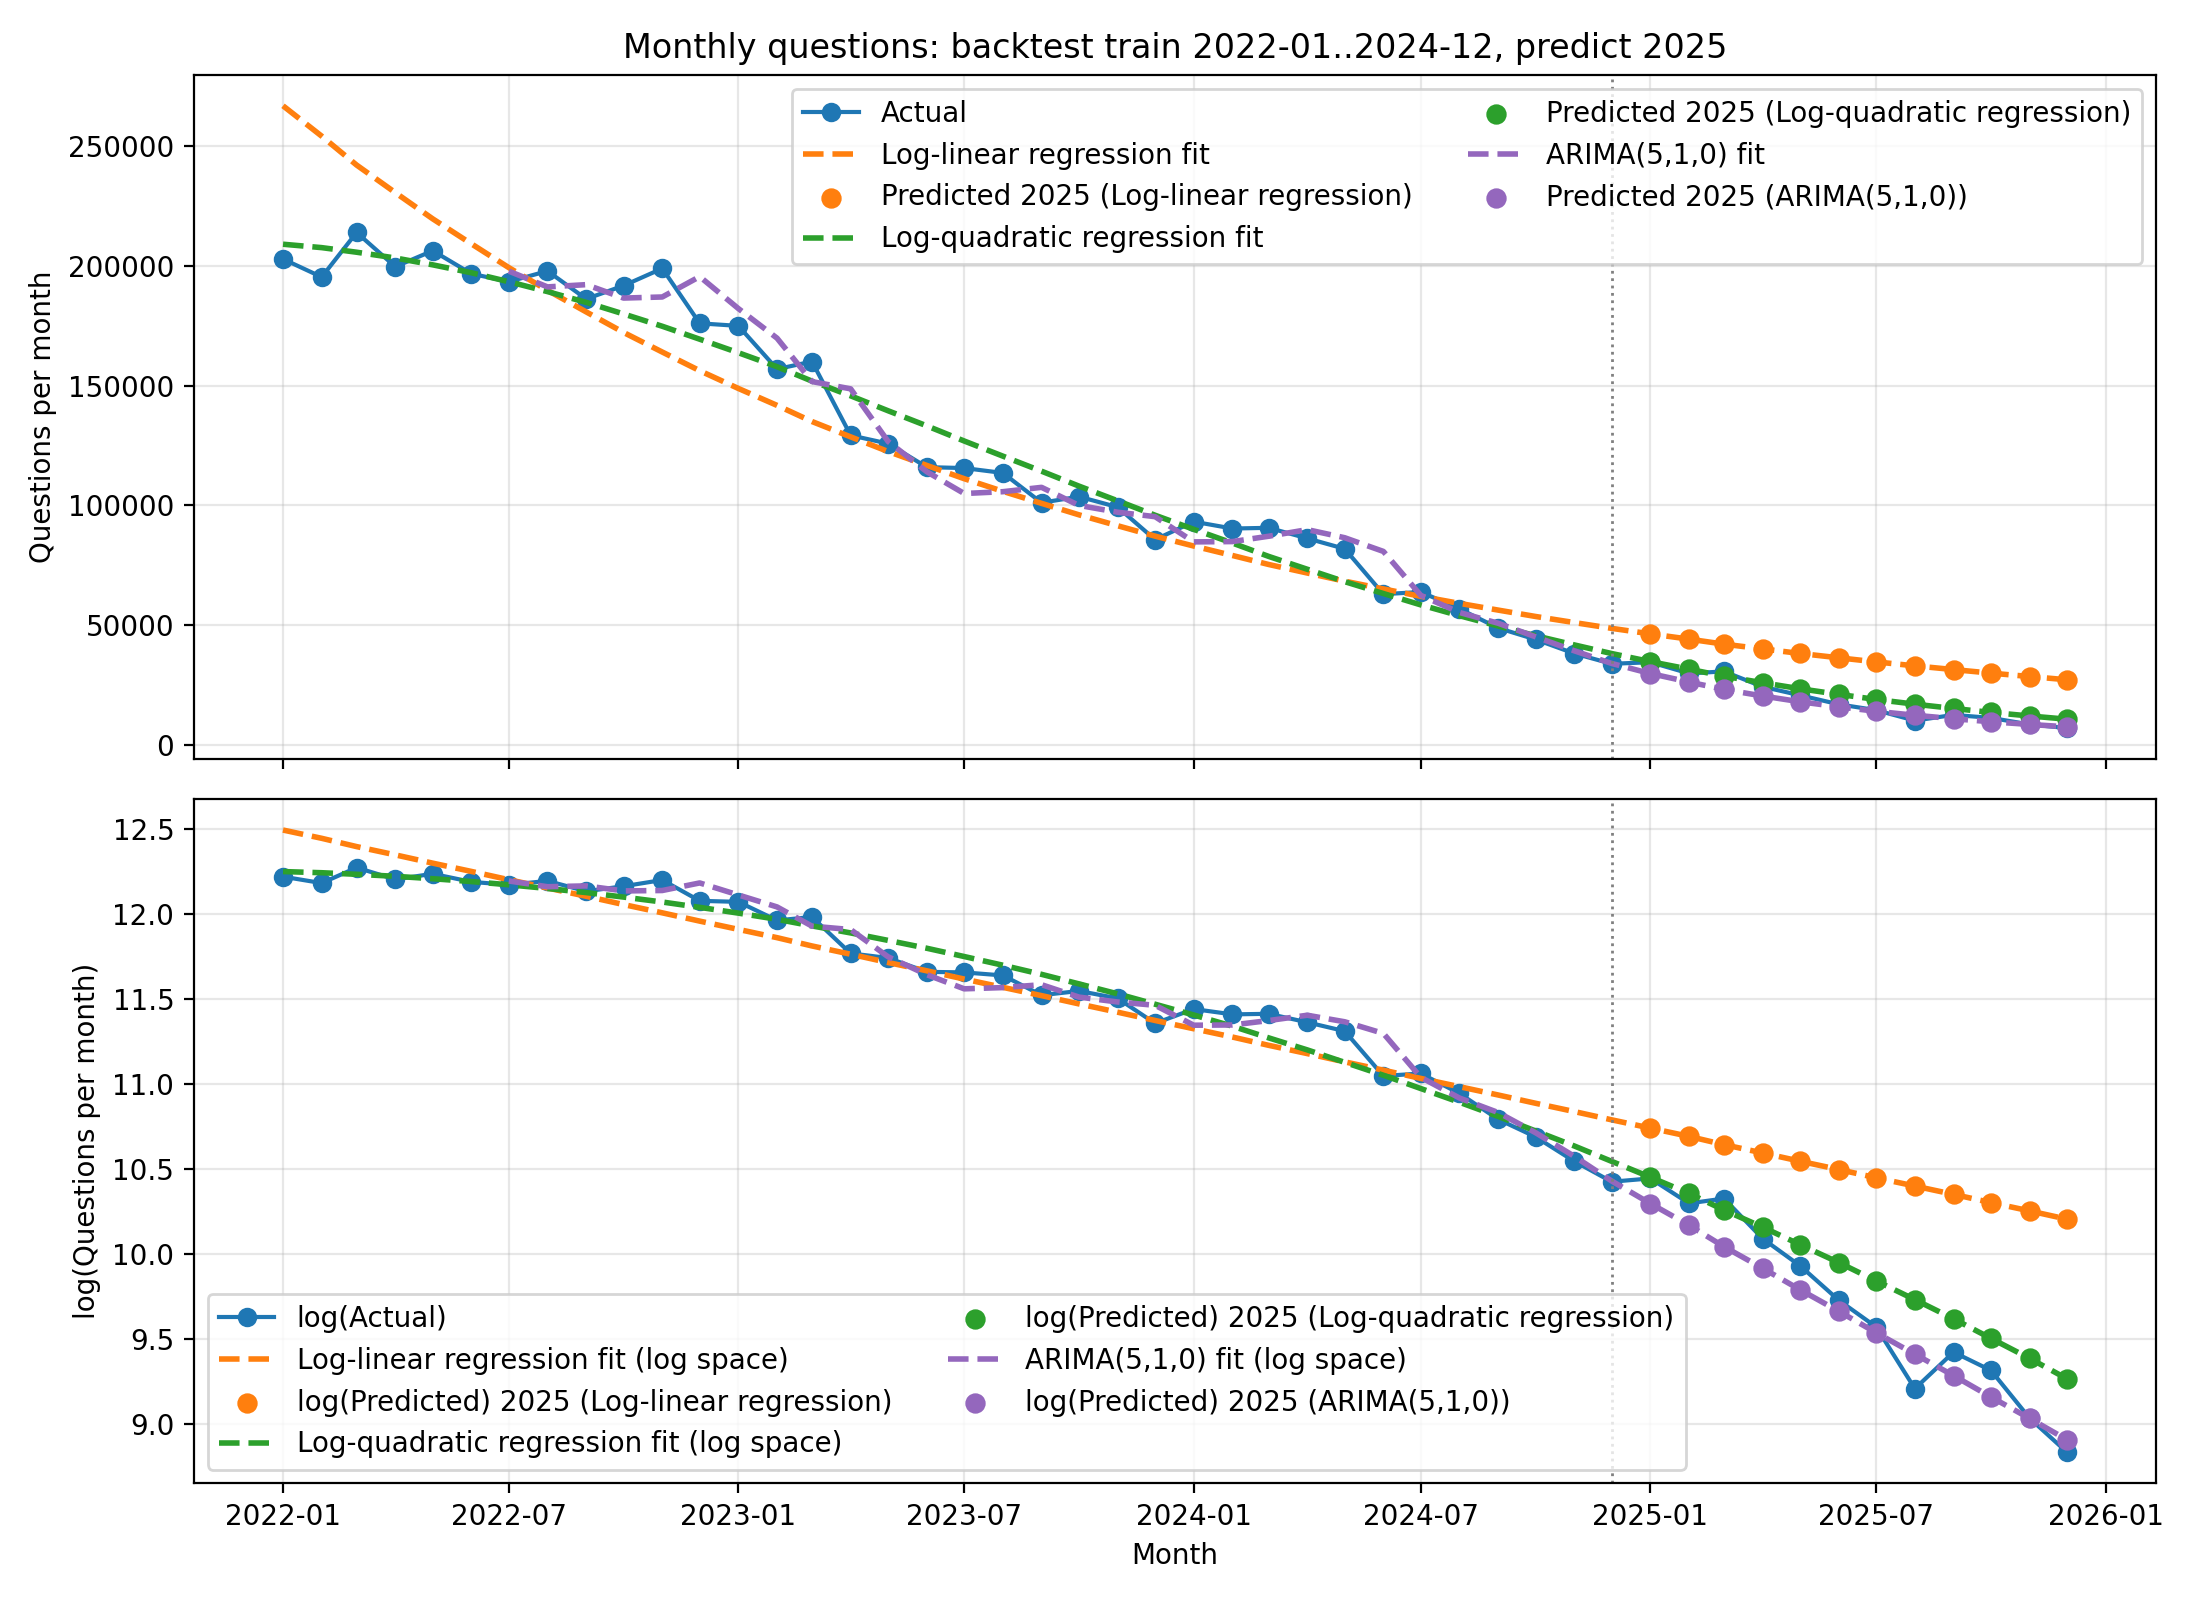
Monthly questions
We also have monthly question counts. The hope is that finer-grained data gives the model more signal (and more training points), so forecasts might improve.
One natural tool for this is ARIMA, a classic time-series model that predicts the next value from past values (and, depending on the setup, past forecast errors). ARIMA stands for AutoRegressive Integrated Moving Average and is written as ARIMA(p, d, q):
- p: how many past values ("lags") the model uses (autoregressive part)
- d: how many times we difference the series to remove trend (integrated part)
- q: how many past forecast errors it uses (moving average part)
ARIMA hyperparameter search: p<= 5, q<= 5, select=val_mae, val_months=6.
| Model | Train window | Pred avg/mo (2025) | Actual avg/mo (2025) | Error | Error % | Pred total 2025 | Actual total 2025 |
|---|---|---|---|---|---|---|---|
| Log-linear regression | 2022-01..2024-12 | 35,869 | 18,269 | 17,600 | +96.3% | 430,434 | 219,229 |
| Log-quadratic regression | 2022-01..2024-12 | 20,951 | 18,269 | 2,682 | +14.7% | 251,414 | 219,229 |
| ARIMA(5,1,0) | 2022-01..2024-12 | 16,237 | 18,269 | -2,032 | -11.1% | 194,842 | 219,229 |
Now for the "predicting the future" part.
Annual avg questions/month (log-quadratic)
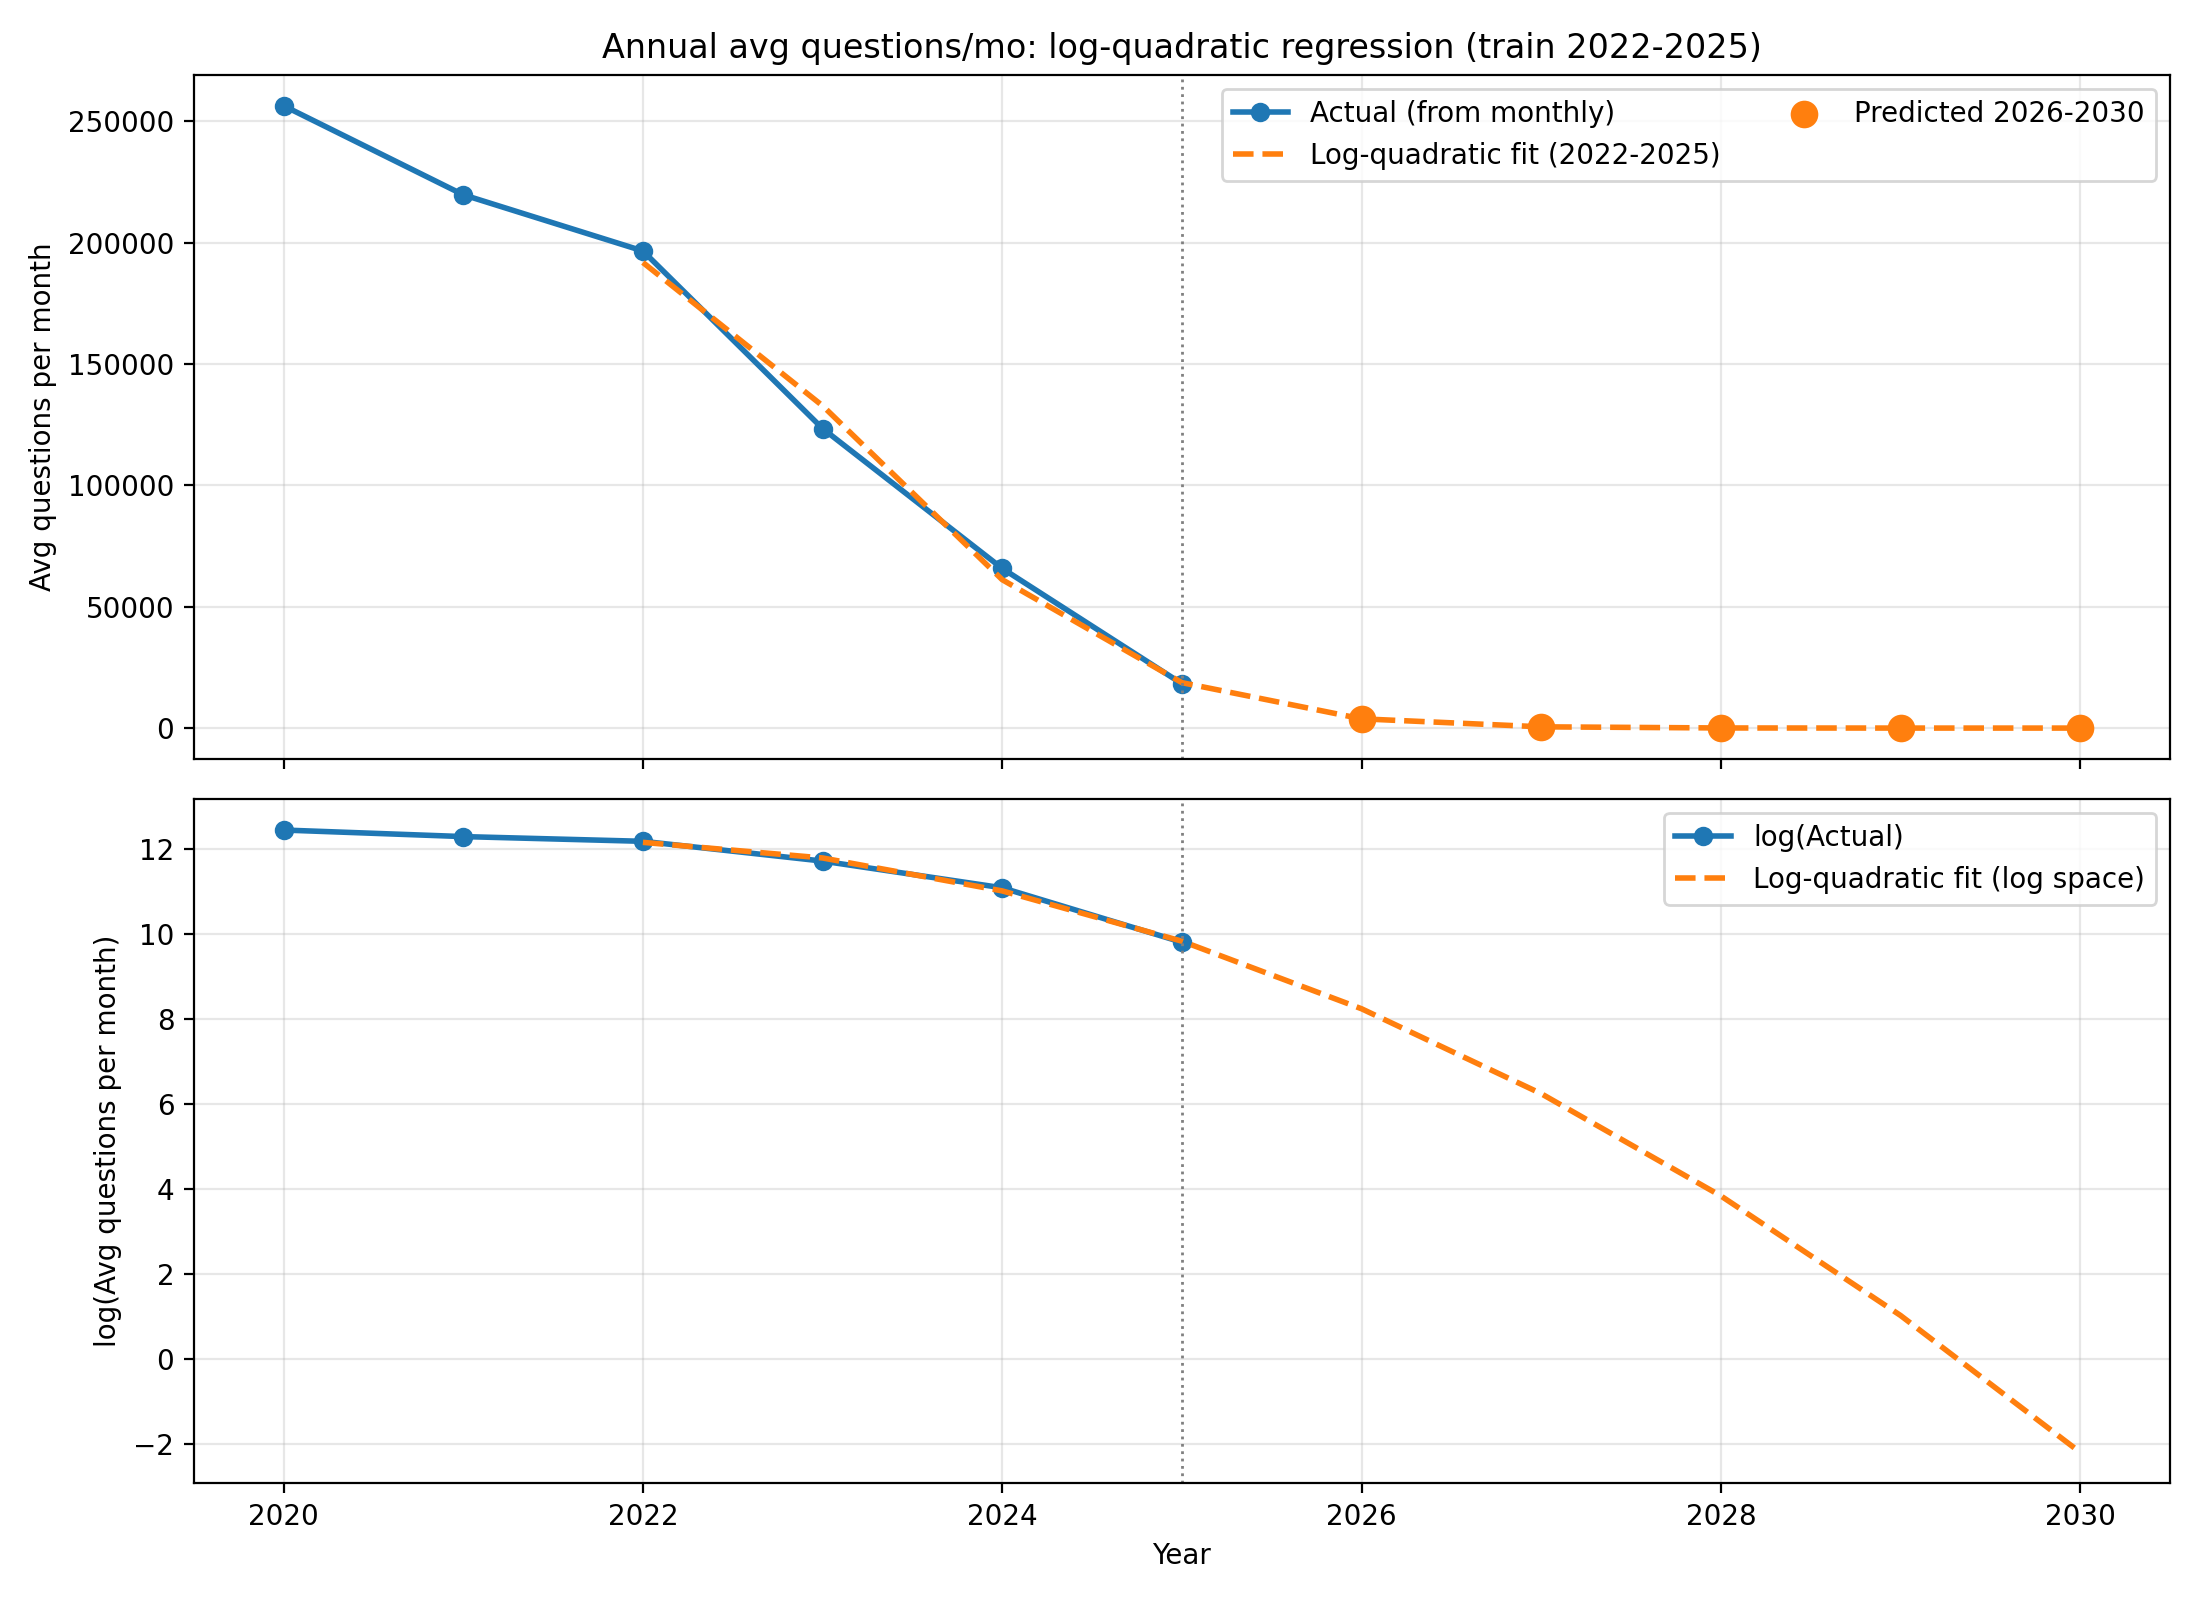
| Model | Train window | 2026 (avg/mo) | 2027 (avg/mo) | 2028 (avg/mo) | 2029 (avg/mo) | 2030 (avg/mo) |
|---|---|---|---|---|---|---|
| Log-quadratic regression | 2022-2025 | 3,812 | 516 | 46 | 3 | 0 |
Annual YoY% (and implied avg)
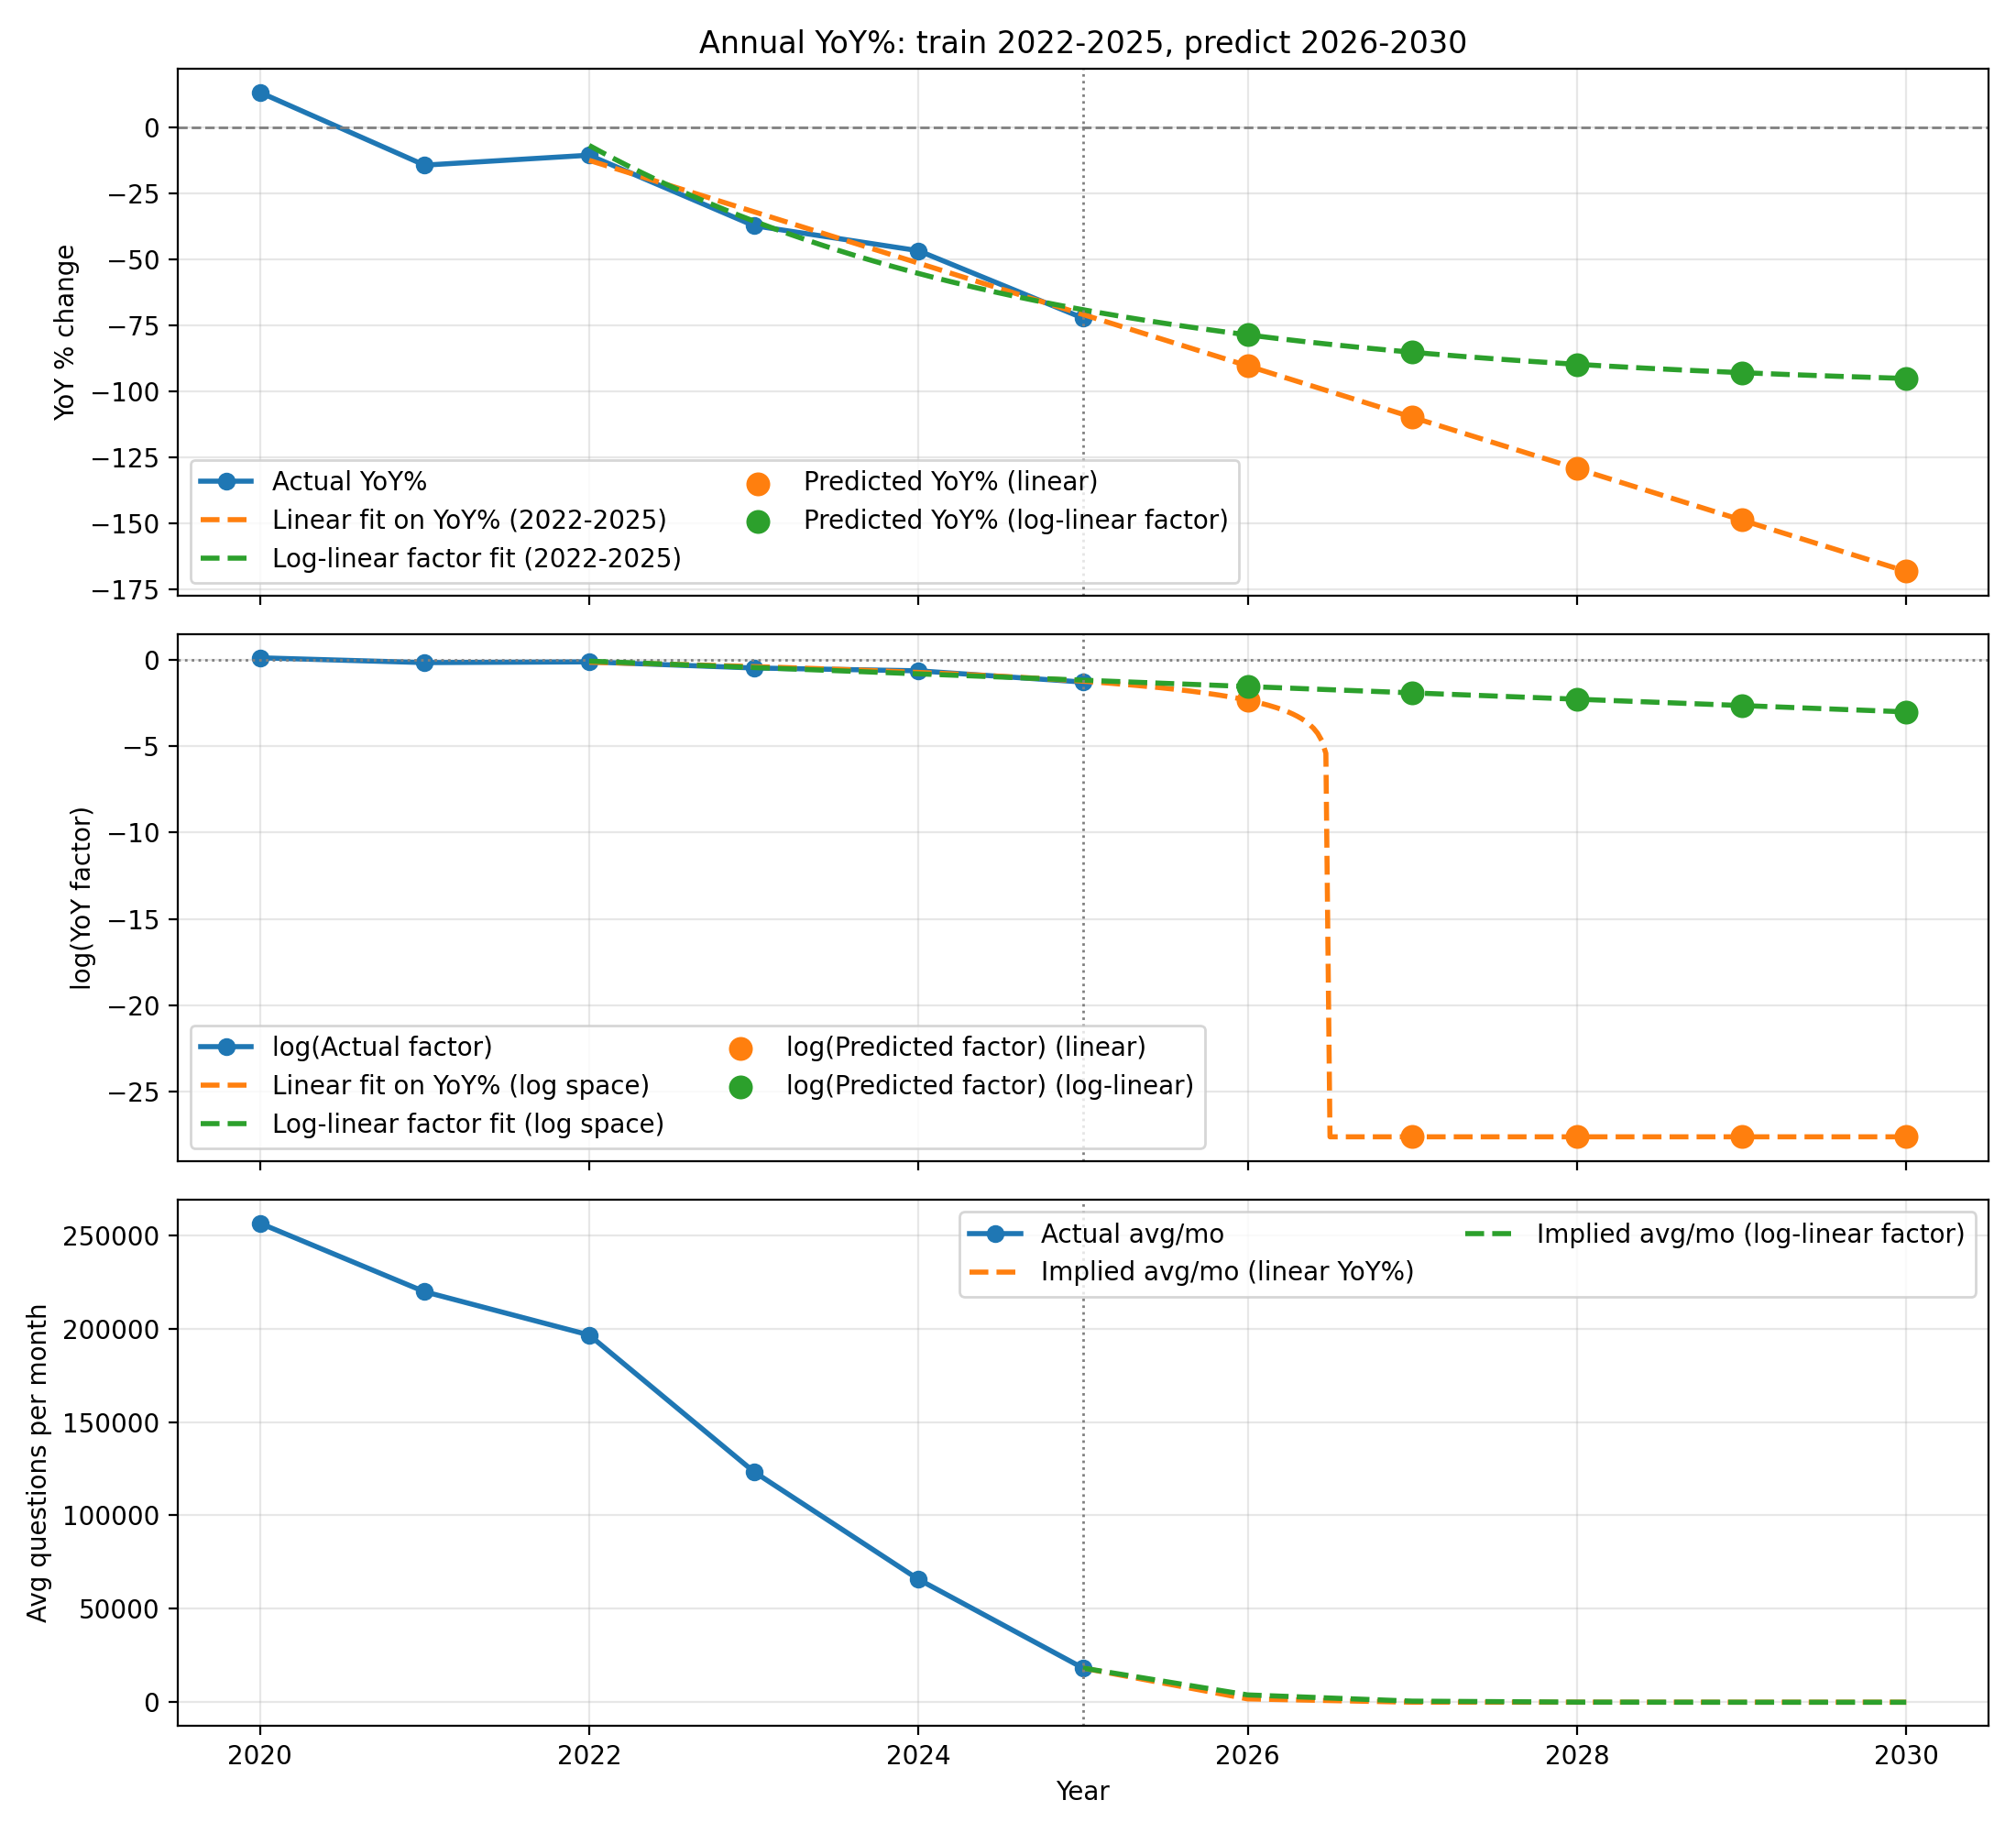
| Model | Train window | Metric | 2026 | 2027 | 2028 | 2029 | 2030 |
|---|---|---|---|---|---|---|---|
| Linear regression on YoY% | 2022-2025 | YoY% | -90.3% | -109.8% | -129.2% | -148.7% | -168.1% |
| Linear regression on YoY% | 2022-2025 | Implied avg/mo | 1,770 | 0 | 0 | 0 | 0 |
| Log-linear factor model | 2022-2025 | YoY% | -78.6% | -85.2% | -89.7% | -92.9% | -95.1% |
| Log-linear factor model | 2022-2025 | Implied avg/mo | 3,916 | 581 | 60 | 4 | 0 |
Monthly questions (log-quadratic + ARIMA)
ARIMA hyperparameter search: p<= 5, q<= 5, select=val_mae, val_months=6.
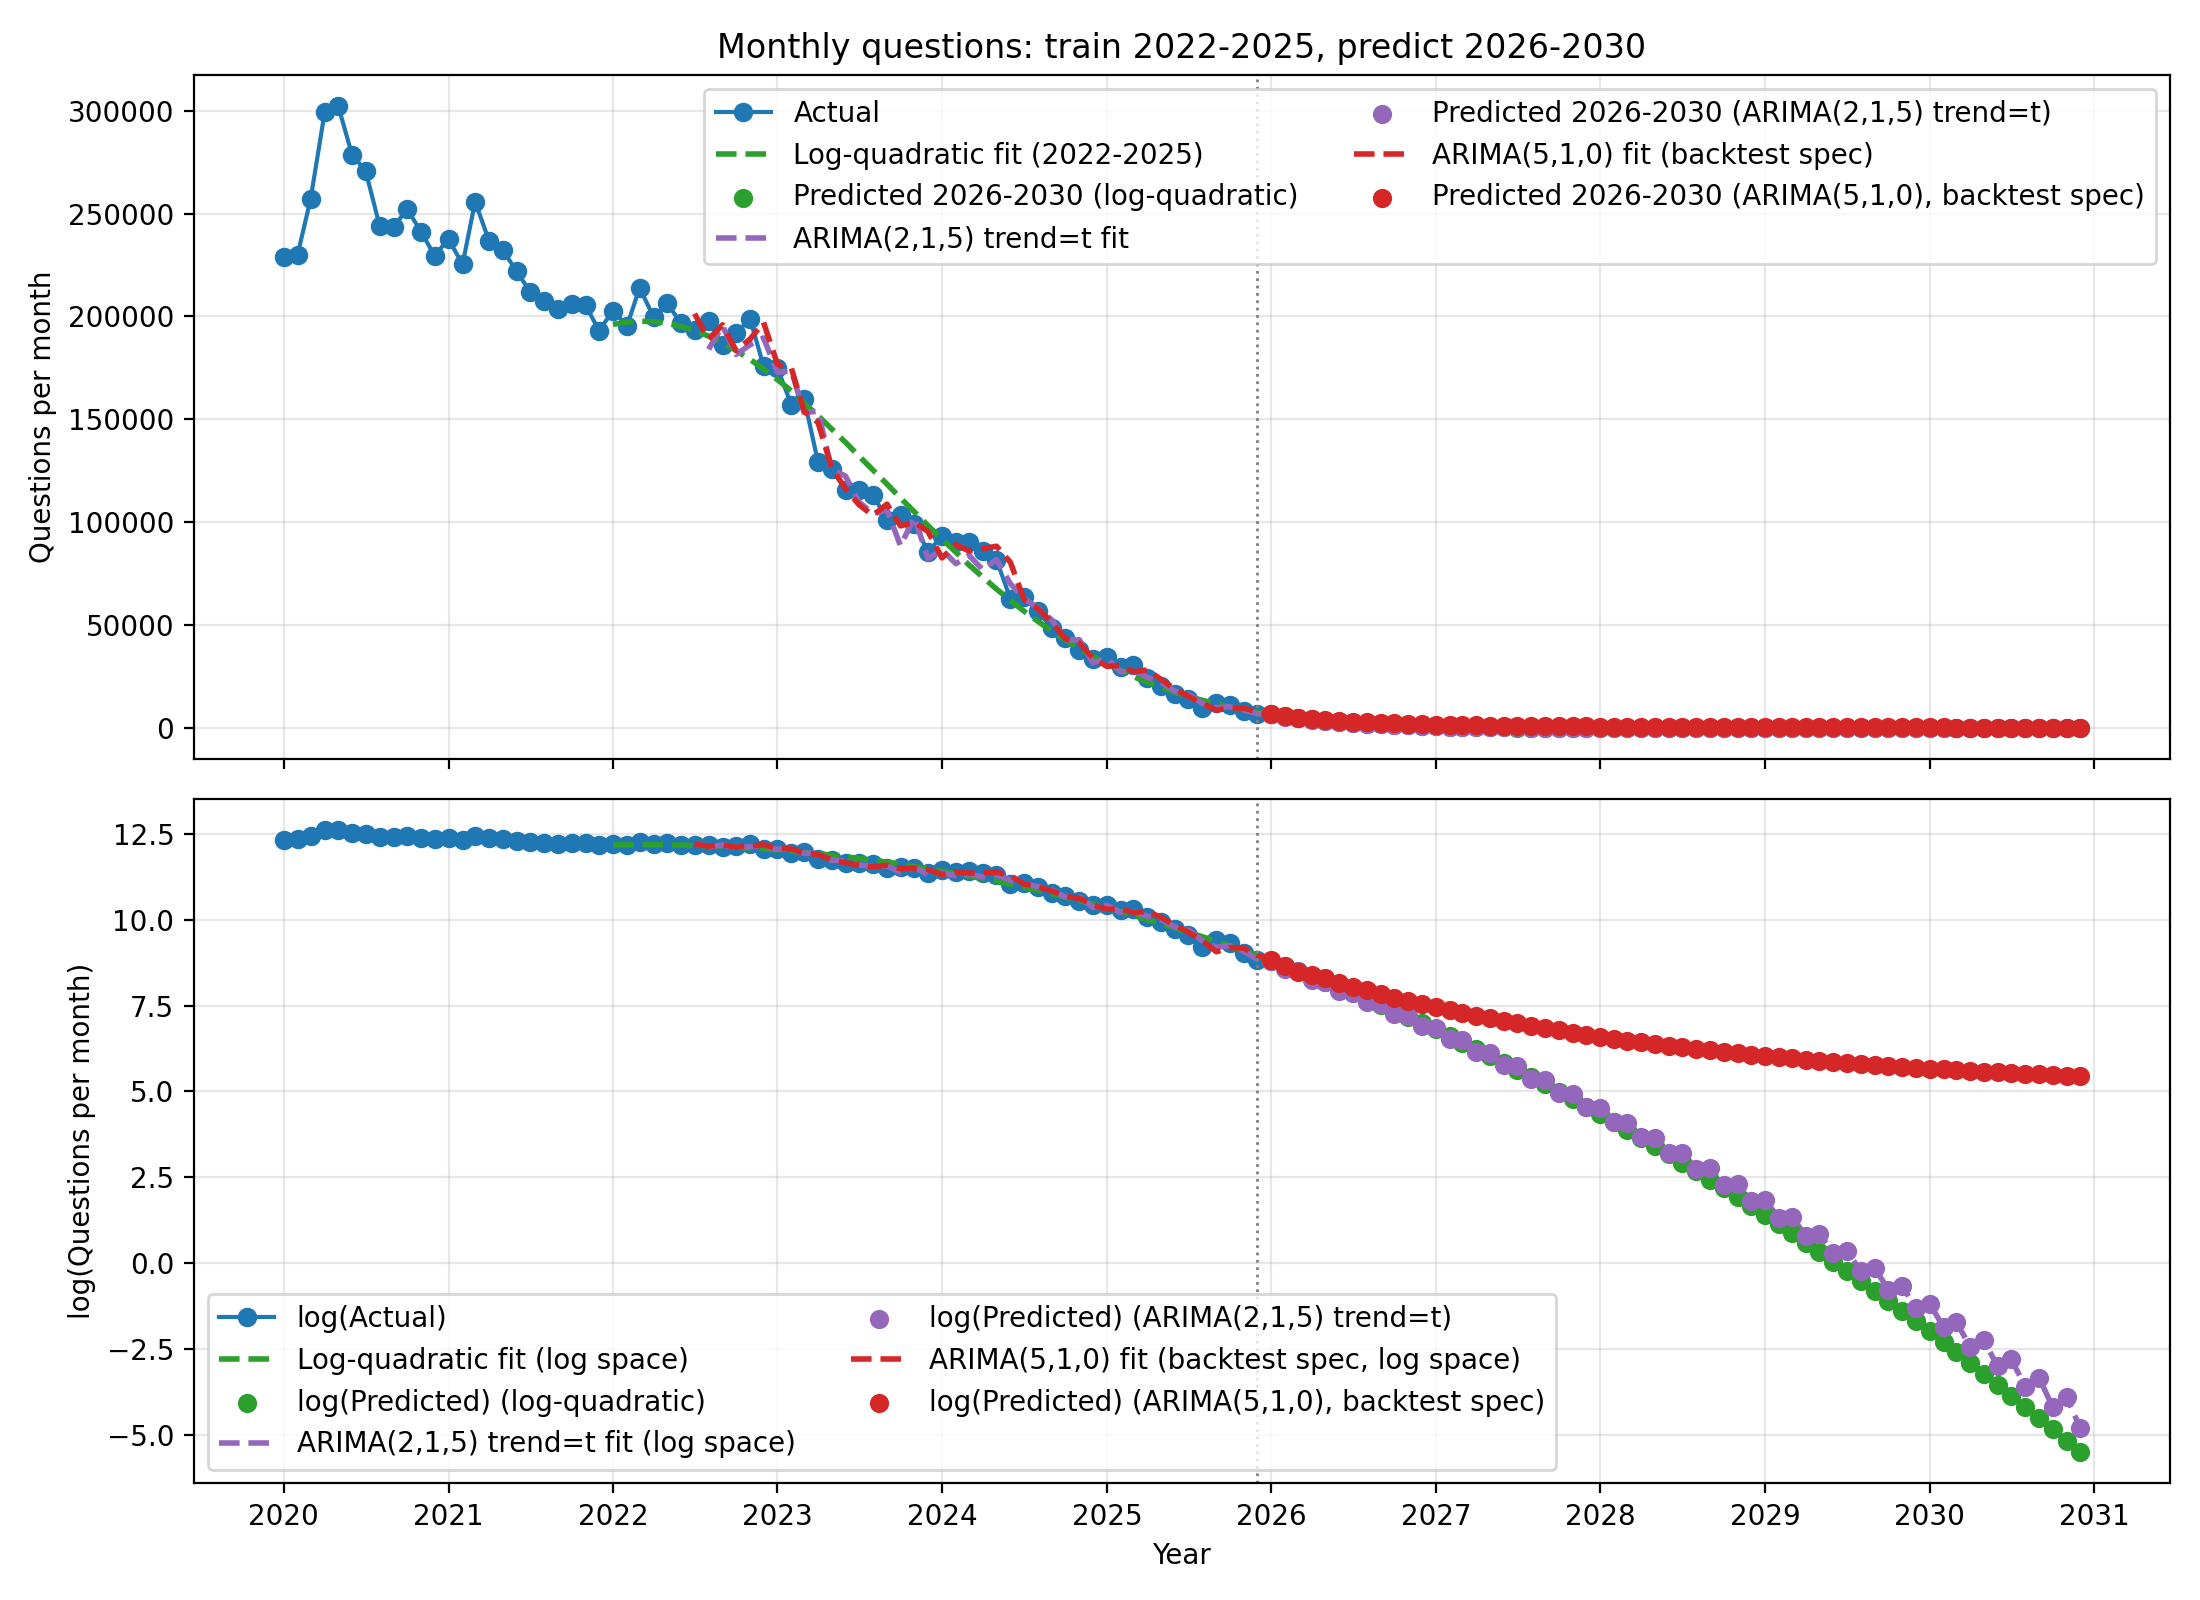
| Model (monthly) | Train window | 2026 (avg/mo) | 2027 (avg/mo) | 2028 (avg/mo) | 2029 (avg/mo) | 2030 (avg/mo) |
|---|---|---|---|---|---|---|
| Log-quadratic regression | 2022-01..2025-12 | 3,249 | 382 | 29 | 1 | 0 |
| ARIMA(2,1,5) trend=t | 2022-01..2025-12 | 3,132 | 387 | 33 | 2 | 0 |
| ARIMA(5,1,0) (trained on 2022-2024) | 2022-01..2024-12 | 3,676 | 1,168 | 562 | 350 | 258 |
The models predict that by 2028 StackOverflow will be practically dead.
No Stack Overflow answers were used in the making of this article :(
(ChatGPT replaced them)